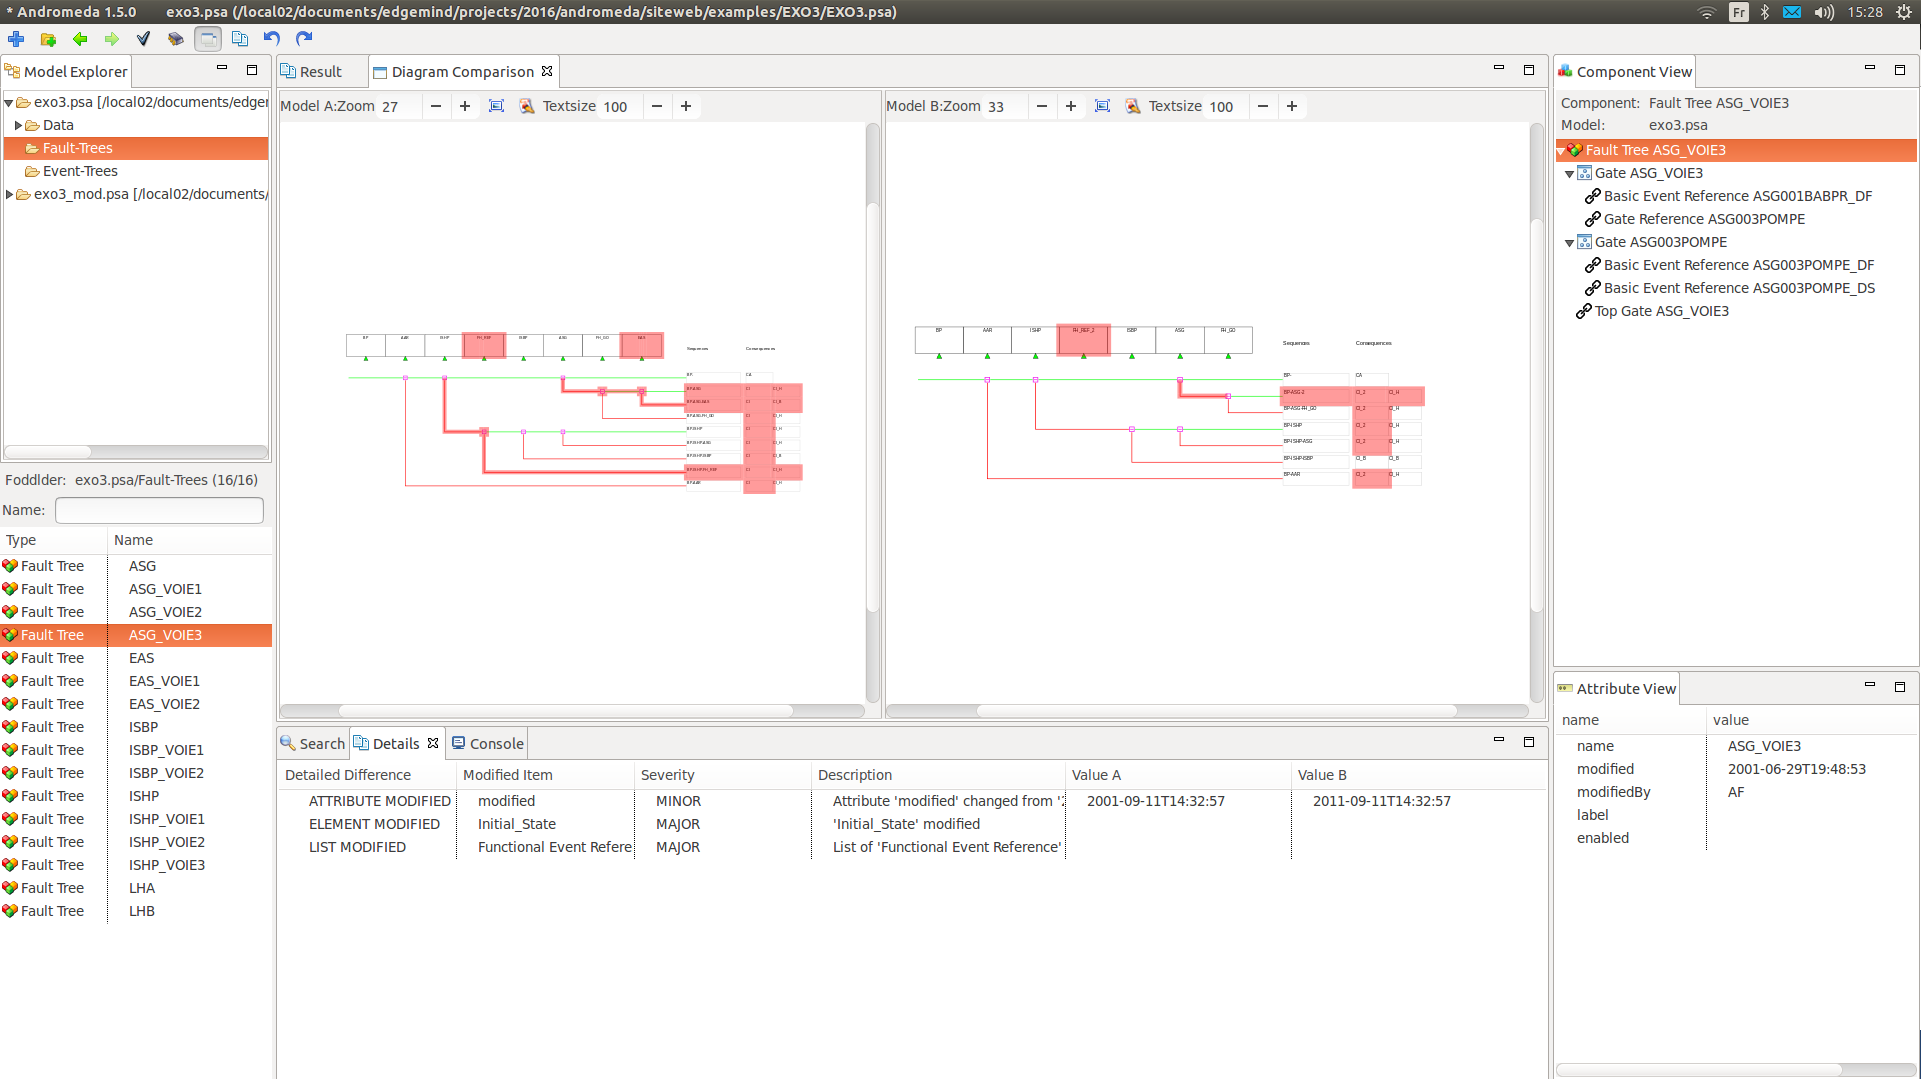
The diagram shows the differences between two event tree diagrams. The red areas indicate the sections that differ. In the example, some function events and sequences have been altered.
Such a comparison can assist PSA model engineers to verify (cross-check) their own modifications or those of others. It supports model engineers to figure out what has changed in the model since a former point in time.
The diagram comparison is actually applied in a second step when comparing PSA models: In a first step, an overview is obtained stating which model element has been modified and what is the modification impact (may it impact quantification results?). Then, in a second step, one is interested to explore individual model elements to figure out their particular modification.
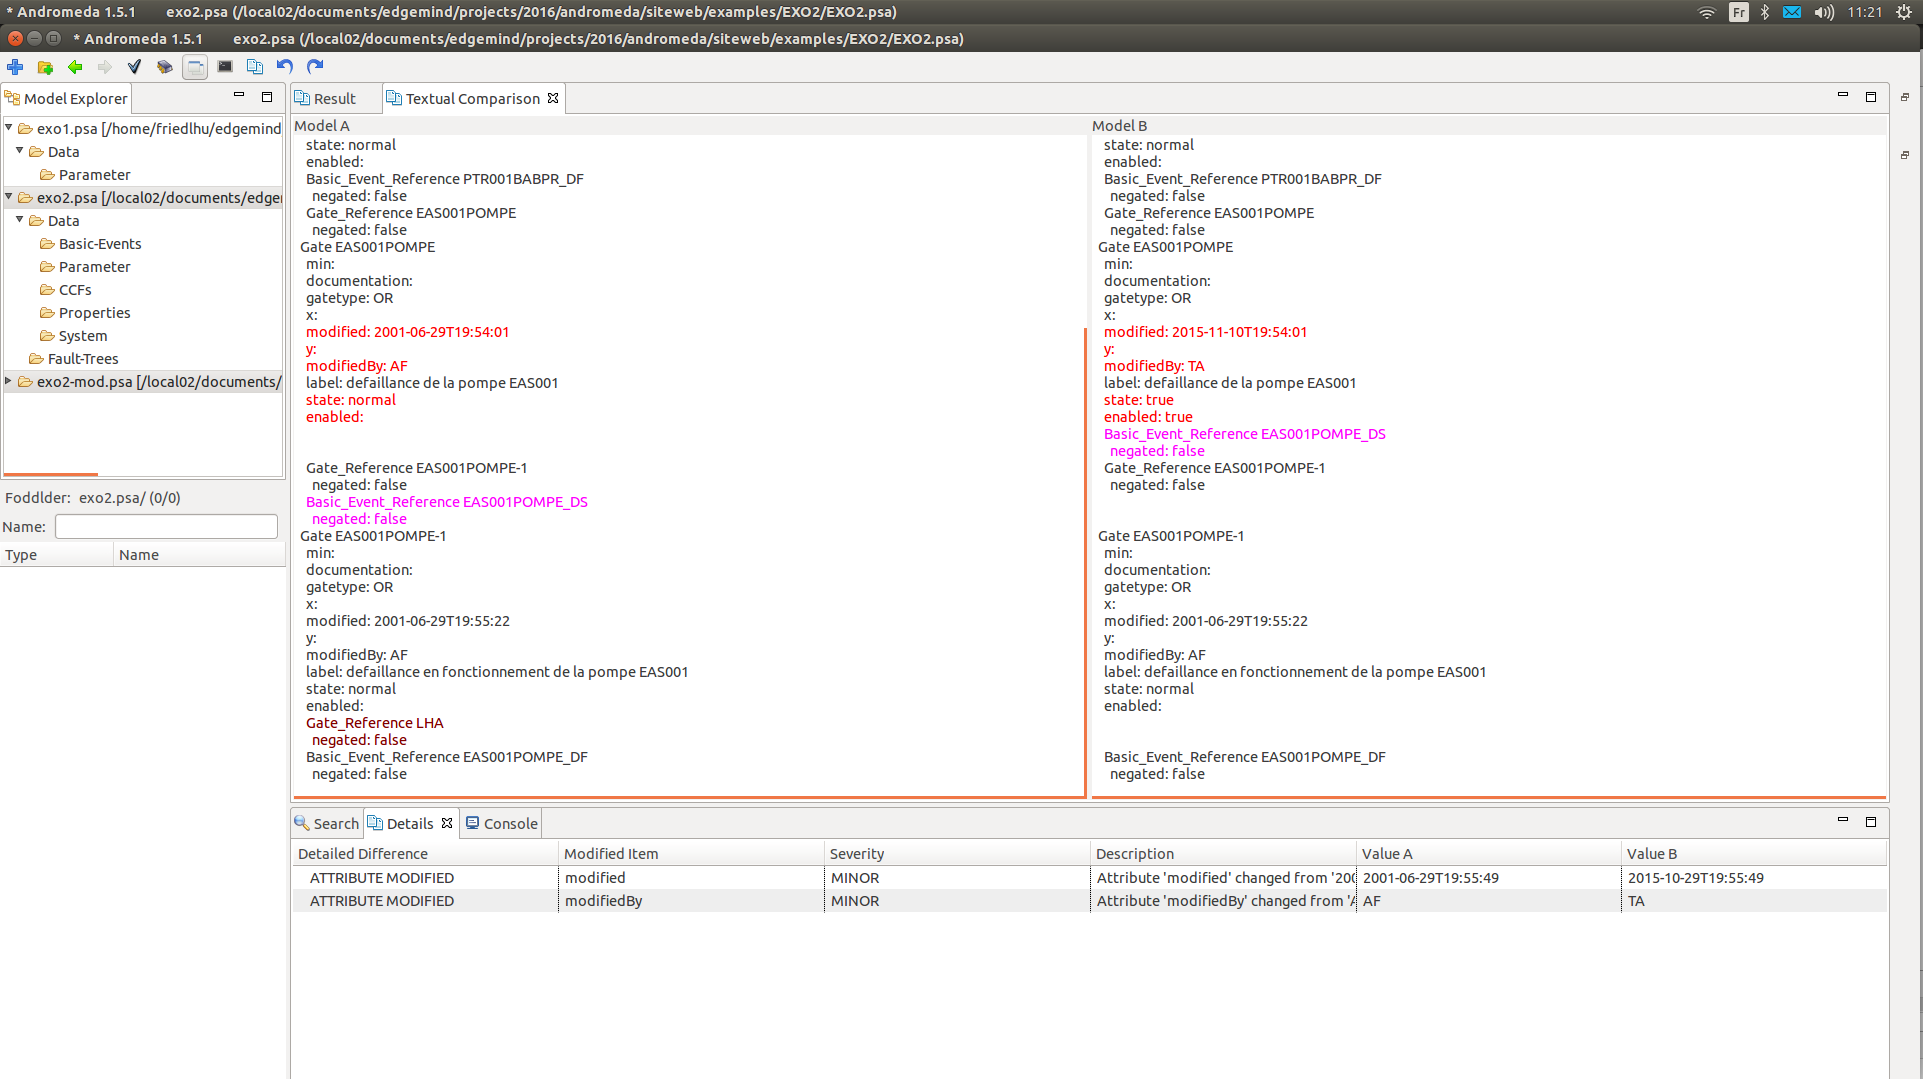
While the mentioned graphical comparison methods are quite intuitive they can lack to display information as they show only modifications displayed in the diagram. For example, if the "modification date" or the "label" have been changed (both information can be saved for each model model element), this change may not be visible in the diagrams.
To obtain the complete set of modifications, a "textual comparison" as illustrated in the example is more adequate: The model element is represented line by line. Then the differences are indicated: Red indicates "modified parts", blue indicates "additional parts", dark red indicates "removed parts" and purple indicates "moved parts".
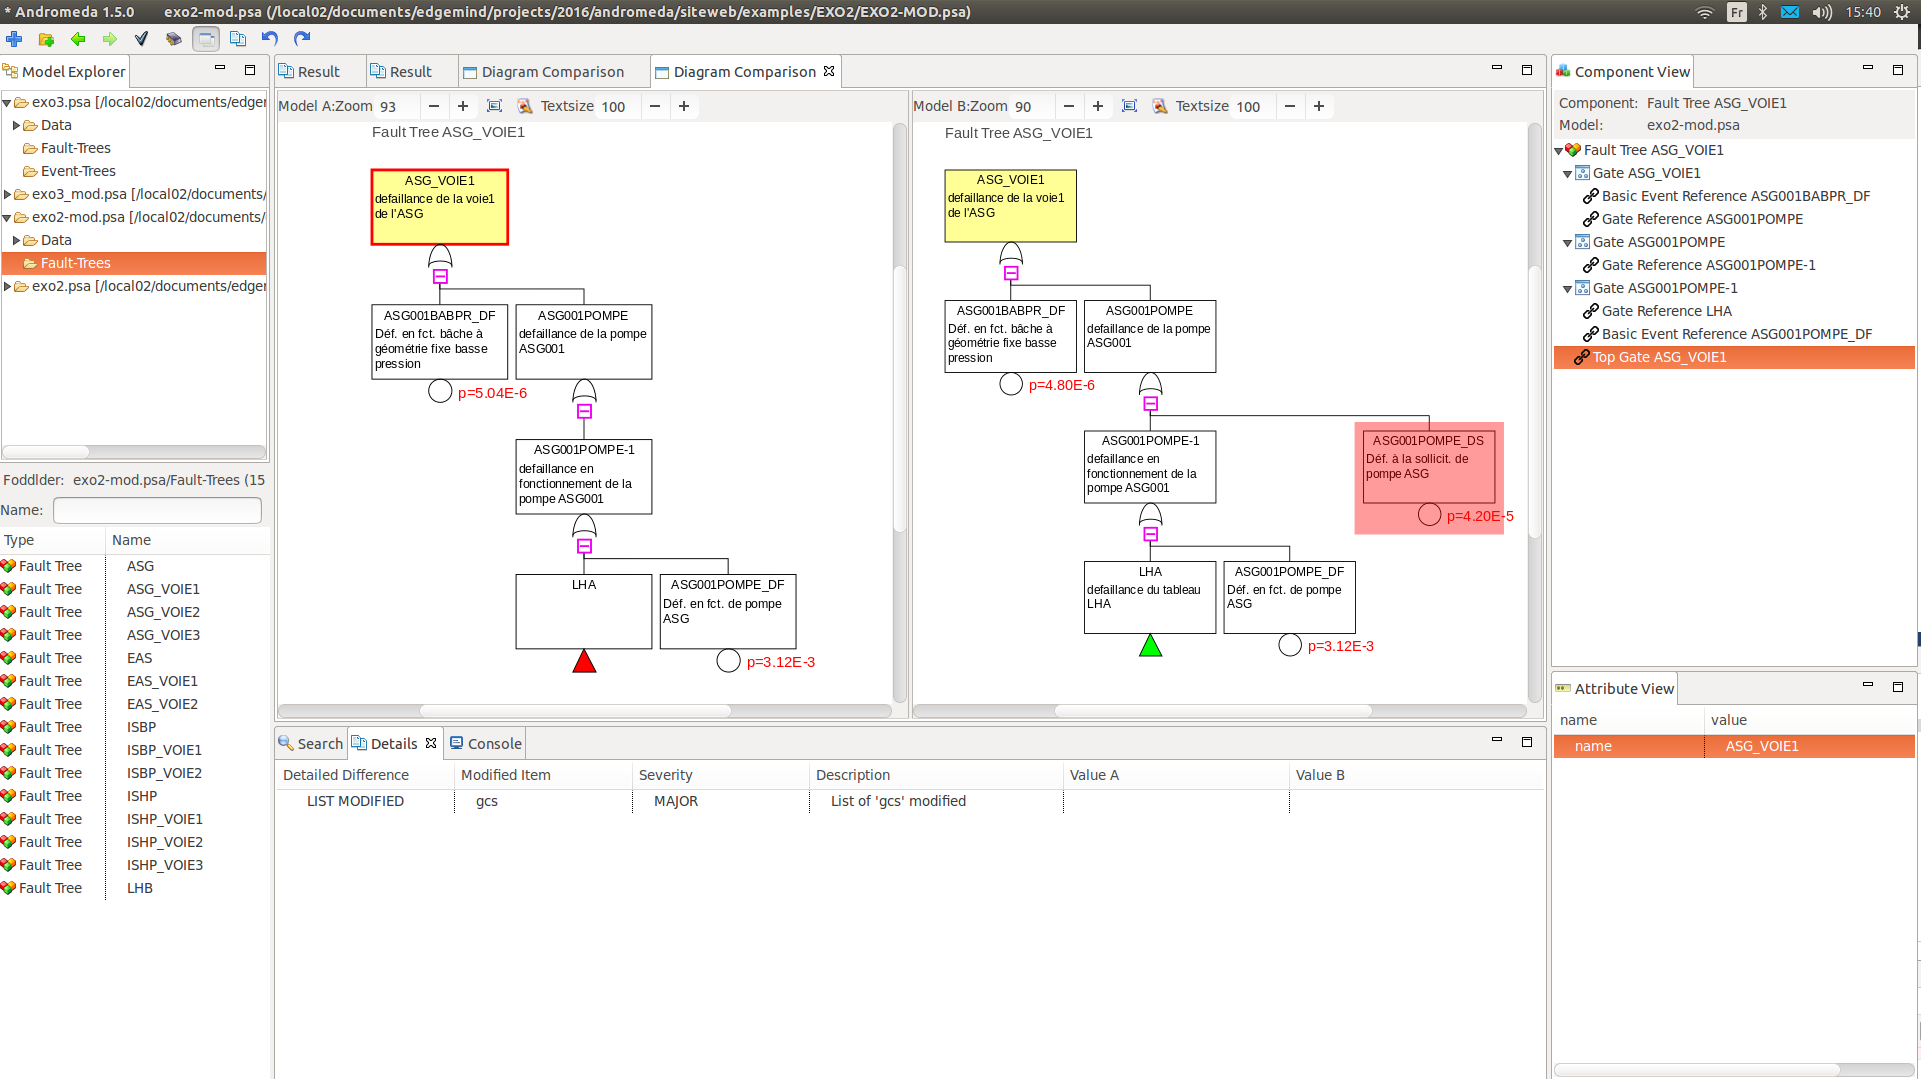
Analog to the previous example, this example shows the differences between two fault tree diagrams. The red area indicates a basic event that has been added. The red triangle below the exchange event (left side, bottom) indicates an unresolved reference (the gate "behind" the exchange event has been removed).
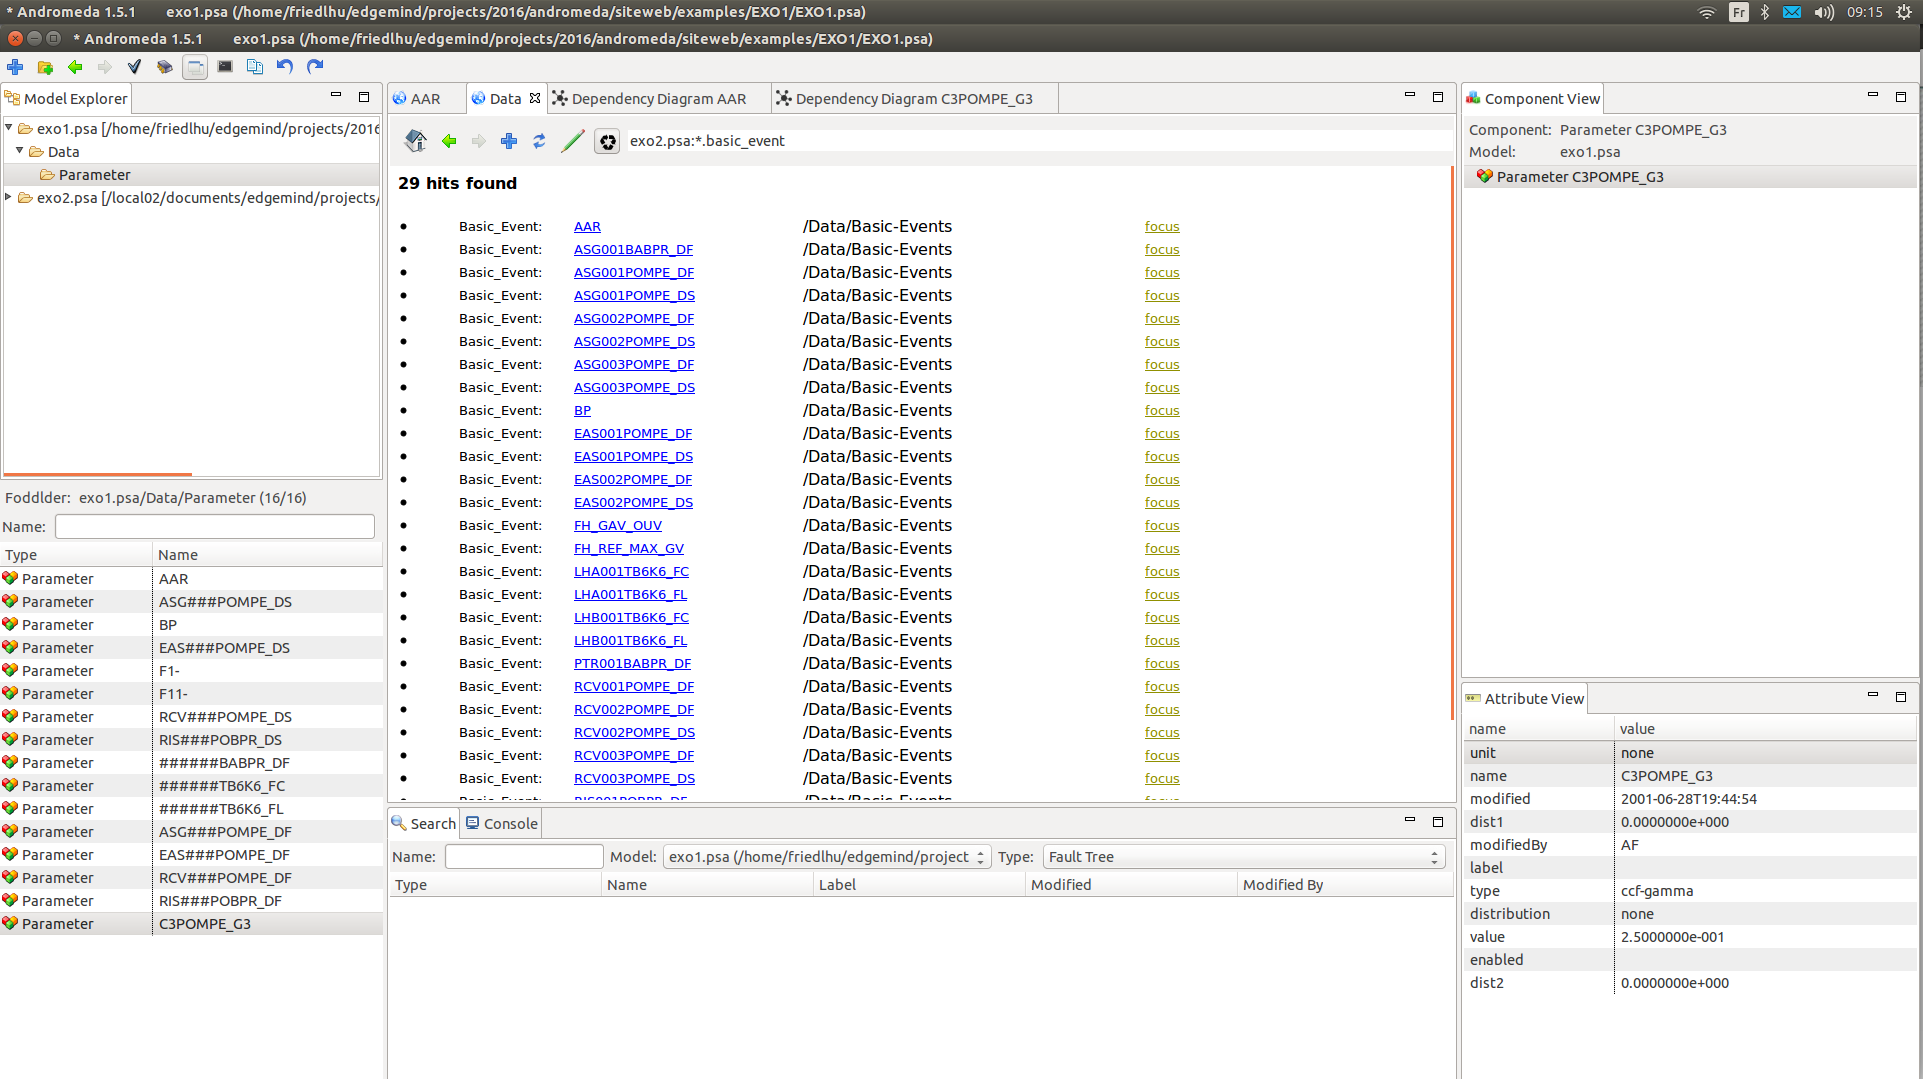
The shown component is named the "Wiki" in Andromeda. It serves primarily to explain the content of a model element similar to a typical "wiki". And it serves also to "browse" the model by the means of an URL address line (see the line above "29 hits found").
In the example, a search expression "exo2.psa:*.basic-event" has been entered in the URL address line and the Wiki lists the corresponding hits: "exo2.psa" states the PSA model (in Andromeda multiple models can be loaded a time). The expression "*.basic-event" is a wildcard search expression to match any basic event (the "*" is the actual wildcard). The search result is then the set of all basic events of model "exo2.psa".
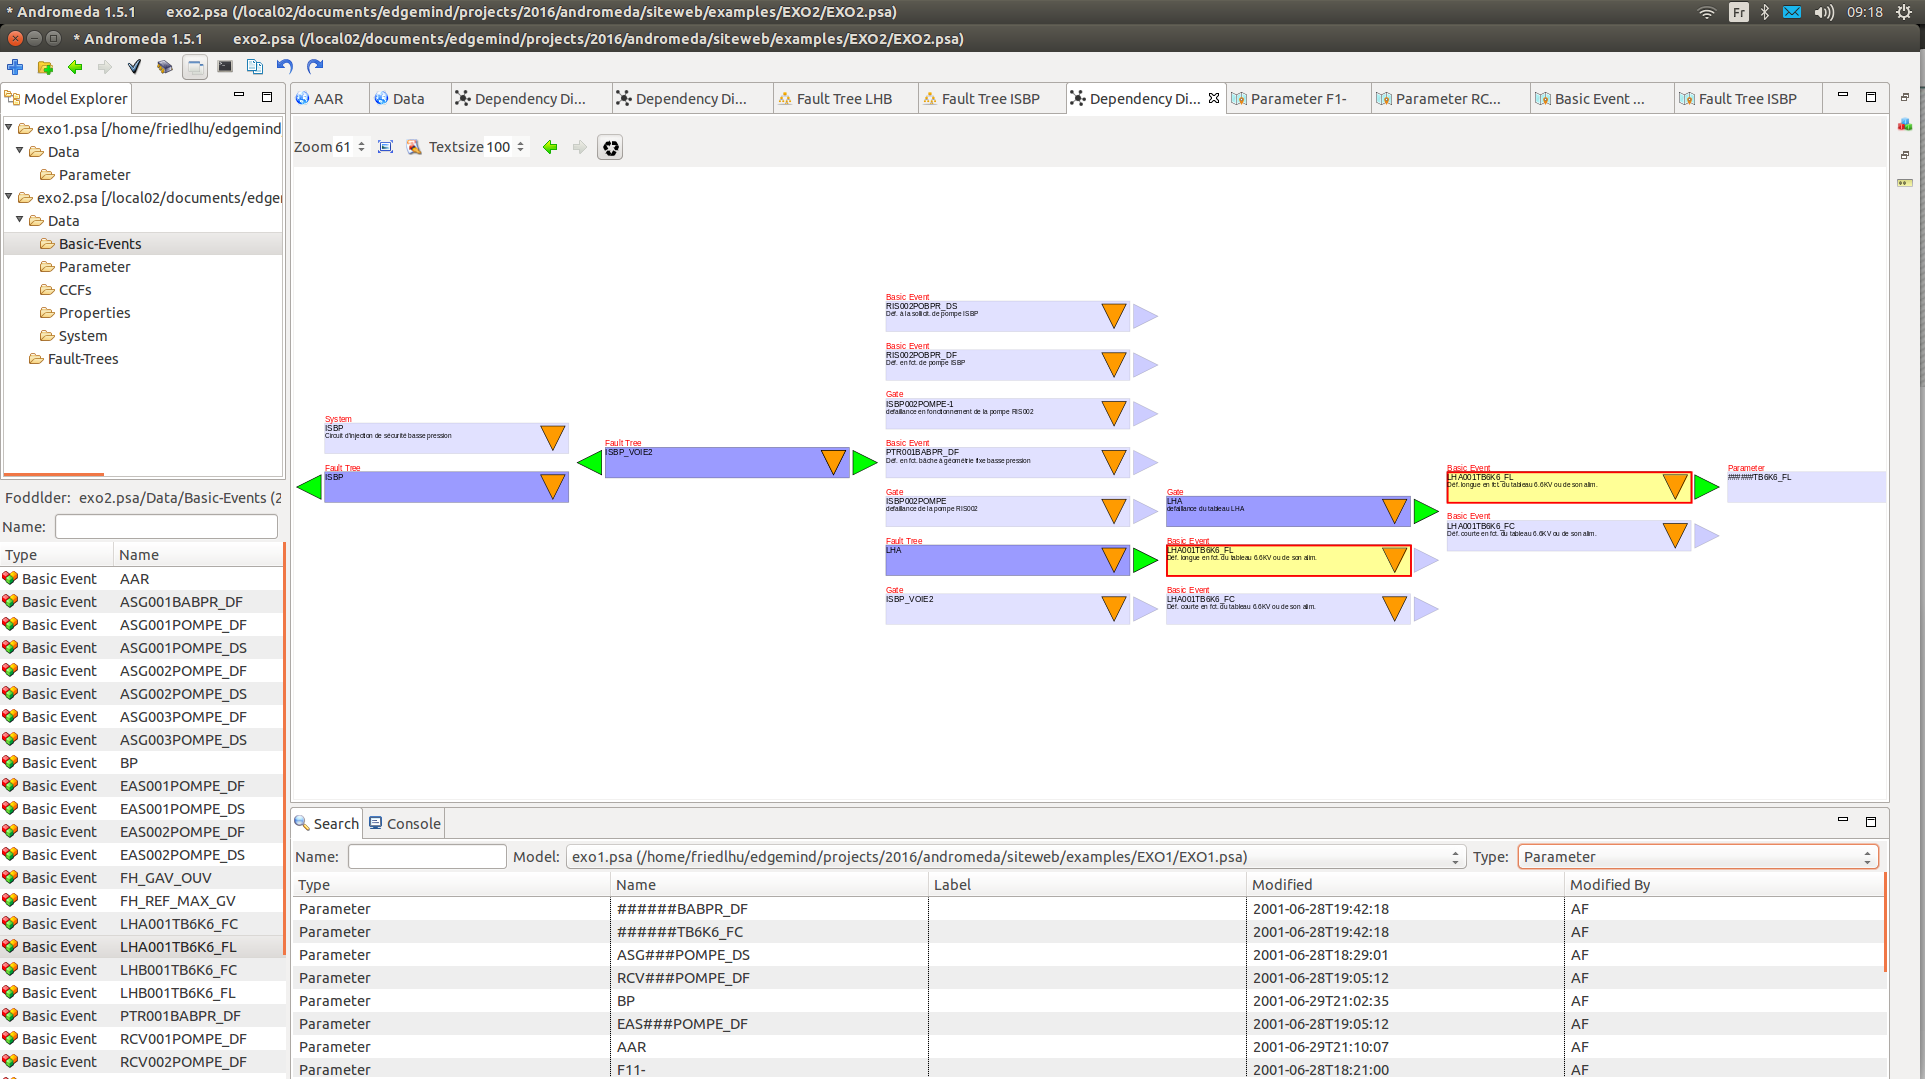
The cartography can be visualized in different ways, one of them is illustrated in the example: The dependencies can iteratively be explored by clicking on the small triangles right / left of model elements (represented as rectangles).
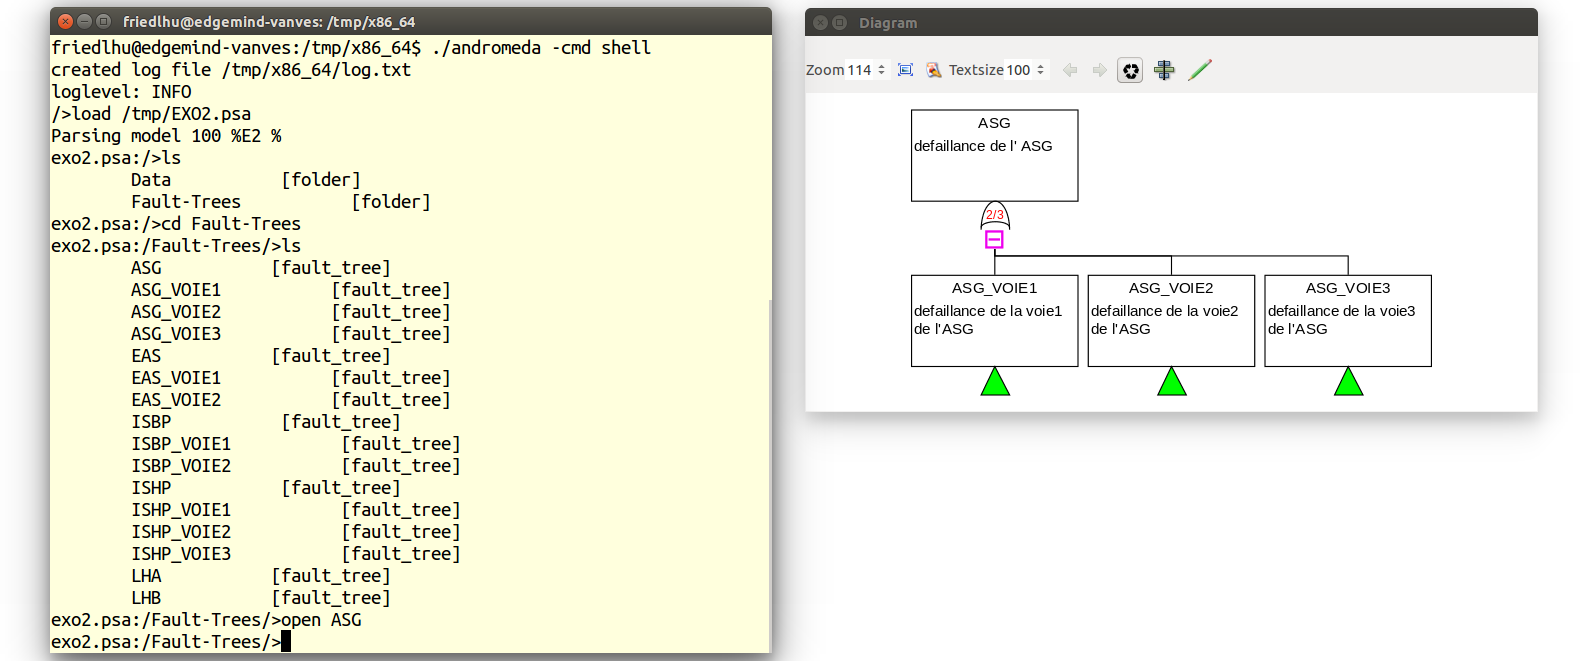
The so-called "Andromeda Shell Interface" is a user interface for executing either individual commands (entered by a user) or complete "scripts" (a script is like a "small program" but without compilation need).
The example shows a session where a user loaded a model, then navigated to the section (of the PSA model) where fault trees are stored, and finally opened the "ASG" fault tree. The Shell Interface can dramatically speedup operations especially for repetitive tasks (e.g. to add a certain gate for a large number of fault trees).
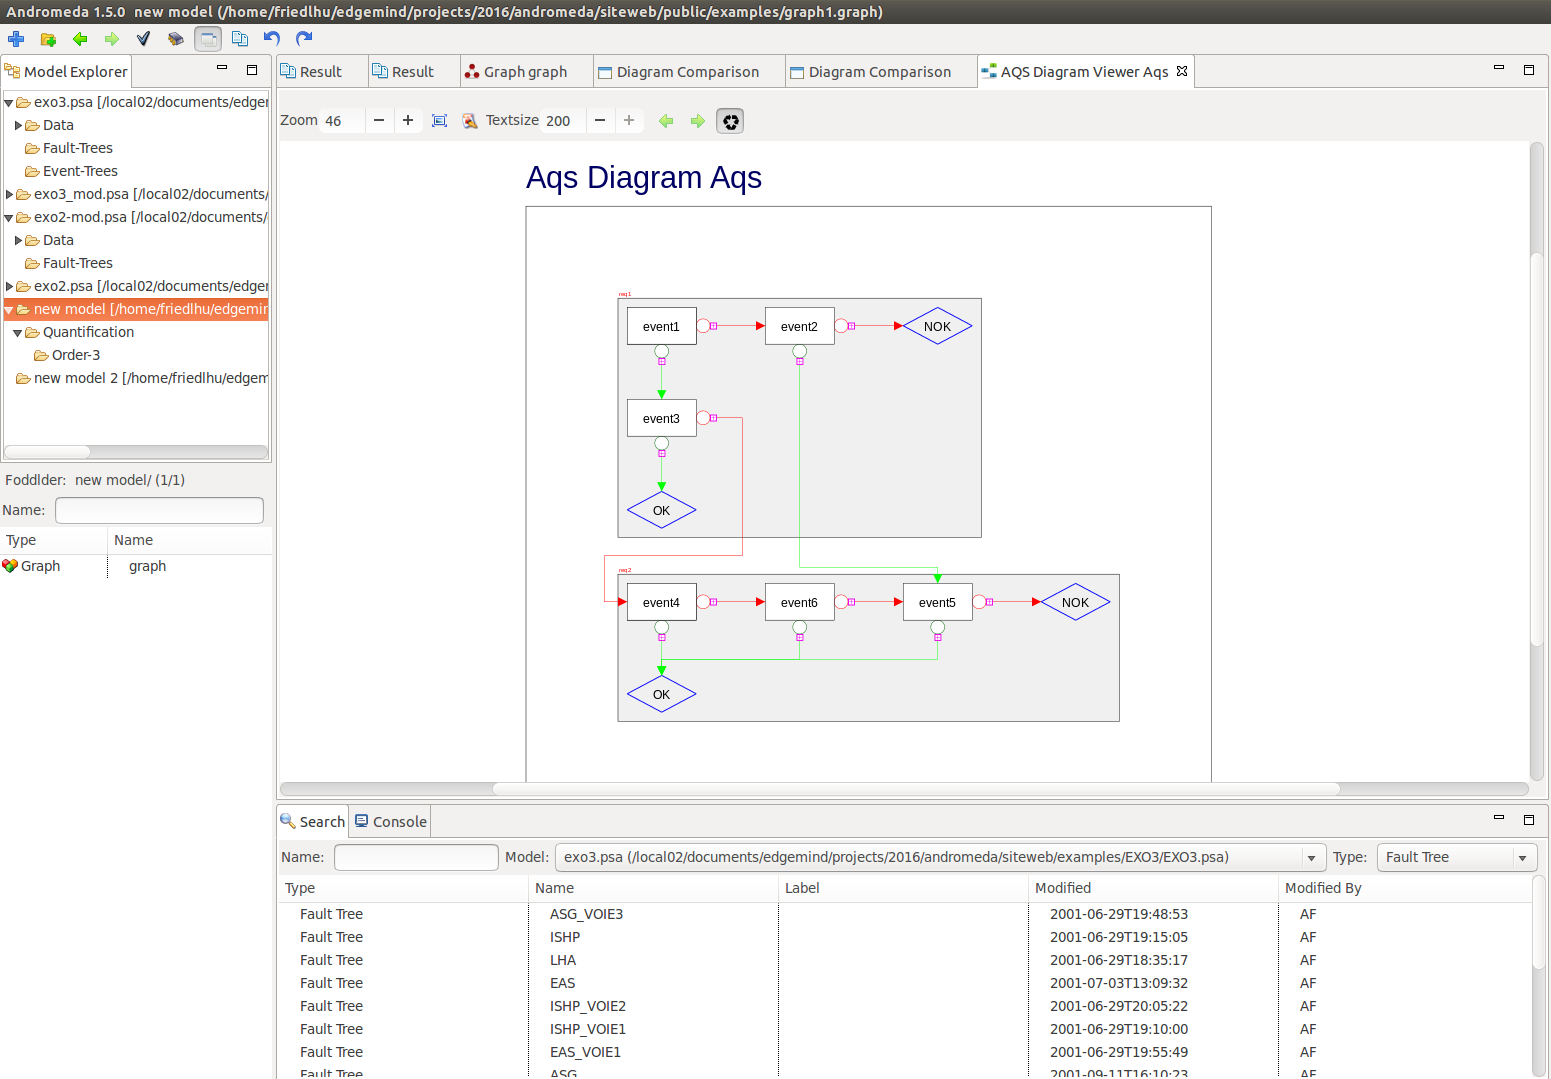
PSA models are usually created "manually". However there are good reasons to generate model parts from other models. The example shows the possibility to specify a so-called AQS model (a sequence diagram). An AQS model represents an event tree logic in a compact and "user-friendly" manner. Further it is then possible to generate the corresponding event tree and to update PSA models accordingly.
The gain is to increase efficiency but also quality: Event trees may contain "repetitive" patterns that are difficult to maintain without provoking modeling errors. The automatic generation from adequate (higher level) languages is a solution to avoid such kind of modeling errors. To complete the picture, also fault trees can be generated from other modeling languages, for example EDF uses "KB3" models (see KB3) for this purpose.
Note that the automatic generation of model parts is often company-specific as it depends on particular requirements (existing tool chains, regulator constraints, model structure etc). The extensible architecture of Andromeda permits to provide company-specific solutions that integrate perfectly in an existing environment.
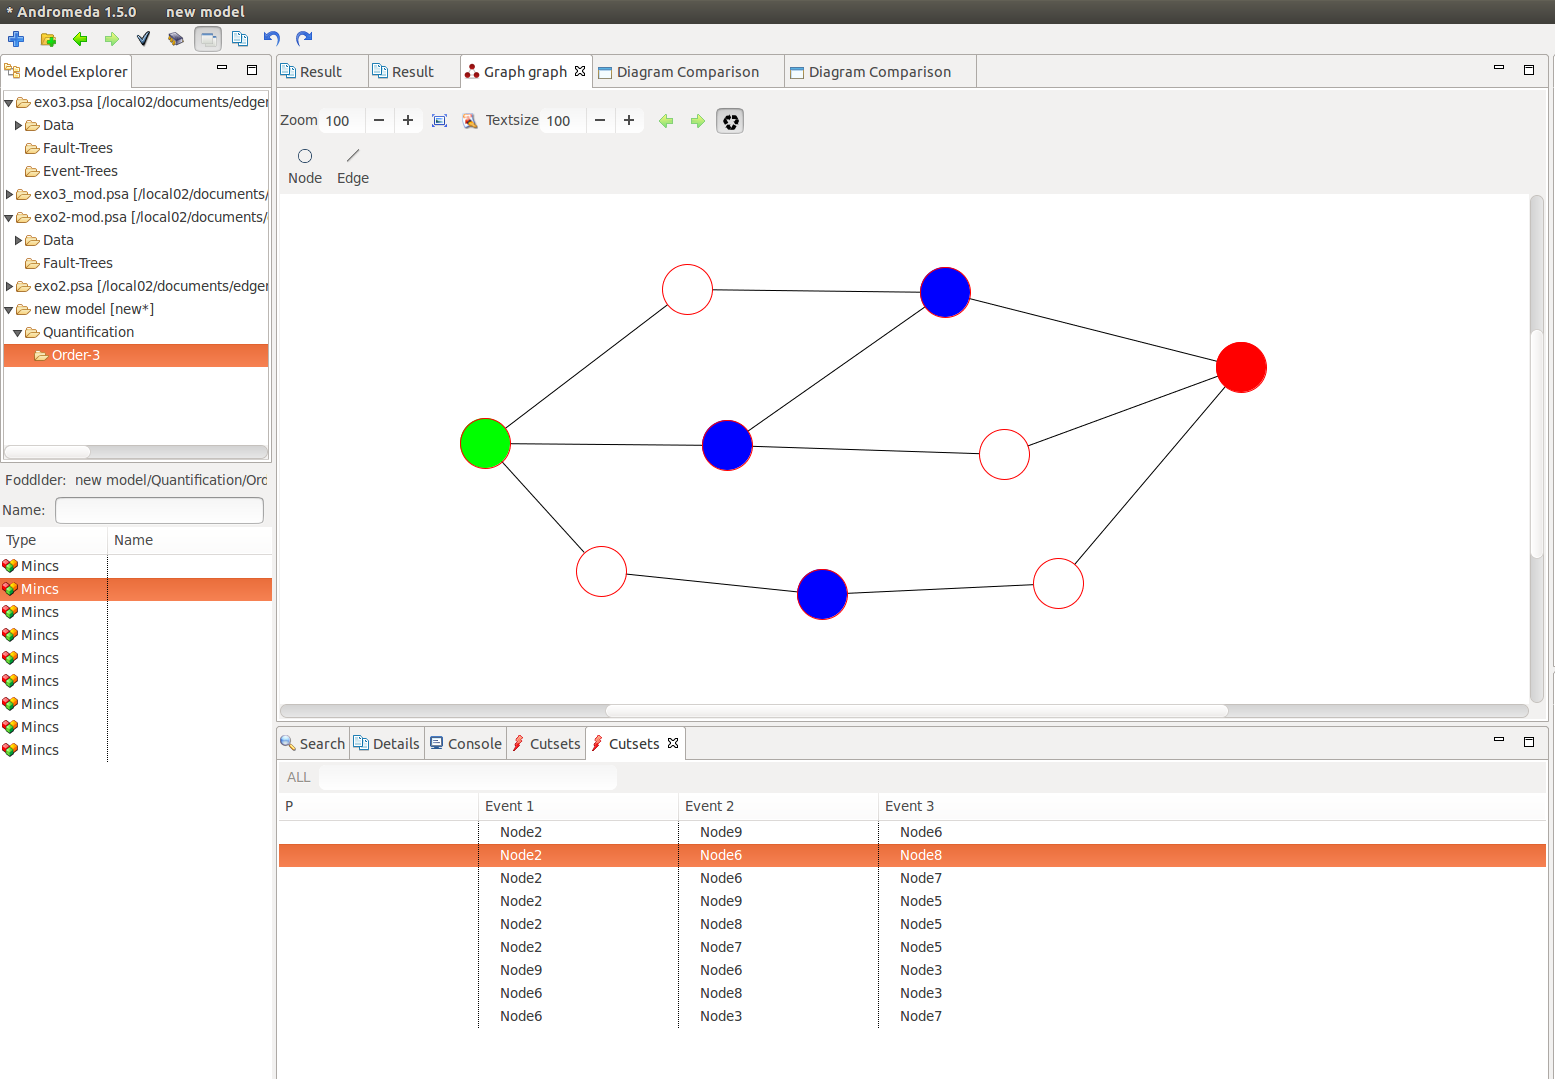
So-called "Graph models" in Andromeda are a possibility to visualize the internal structure of fault trees in form of graphs (A fault tree can be converted into a graph): The nodes represent fault tree gates and each node can be connected to a reliability specification. A reliability specification is in return "linked" to a basic event.
Graphs serve to analyze the model structure and to navigate into the model (graphs can be connected to sub-graphs). Also, graphs can be quantified: A graph is then failing, if the "source node" (the green node) is no longer connected to the "target node" (the red node). The blue nodes represent a "cutset" of the graph. The corresponding basic events (of a cutset) are those linked by the cutset nodes.